
What is Spatial Data?
Spatial data is information about where things are, what they are, and how they relate to other things around them.
It is the data behind digital maps, satellite imagery, navigation apps, property maps, network planning, environmental analysis and location intelligence.
If you have ever used Google Maps to find a business, looked at a property boundary, followed a delivery on a map or viewed satellite imagery, you have interacted with spatial data.
At its simplest, spatial data answers two questions:
Where is it?
What is it?
For example, a dataset might tell you that a particular tree is located at a specific latitude and longitude, that it is a eucalyptus tree, and that it is 12 metres tall.
Spatial data can represent almost anything that has a location, from a single address to an entire road network, a property boundary, a satellite image or the temperature across a city.
The two main types of spatial data
There are two fundamental ways of representing geographic information:
Vector data and Raster data.
The easiest way to think about the difference is:
Vector = things
Raster = surfaces
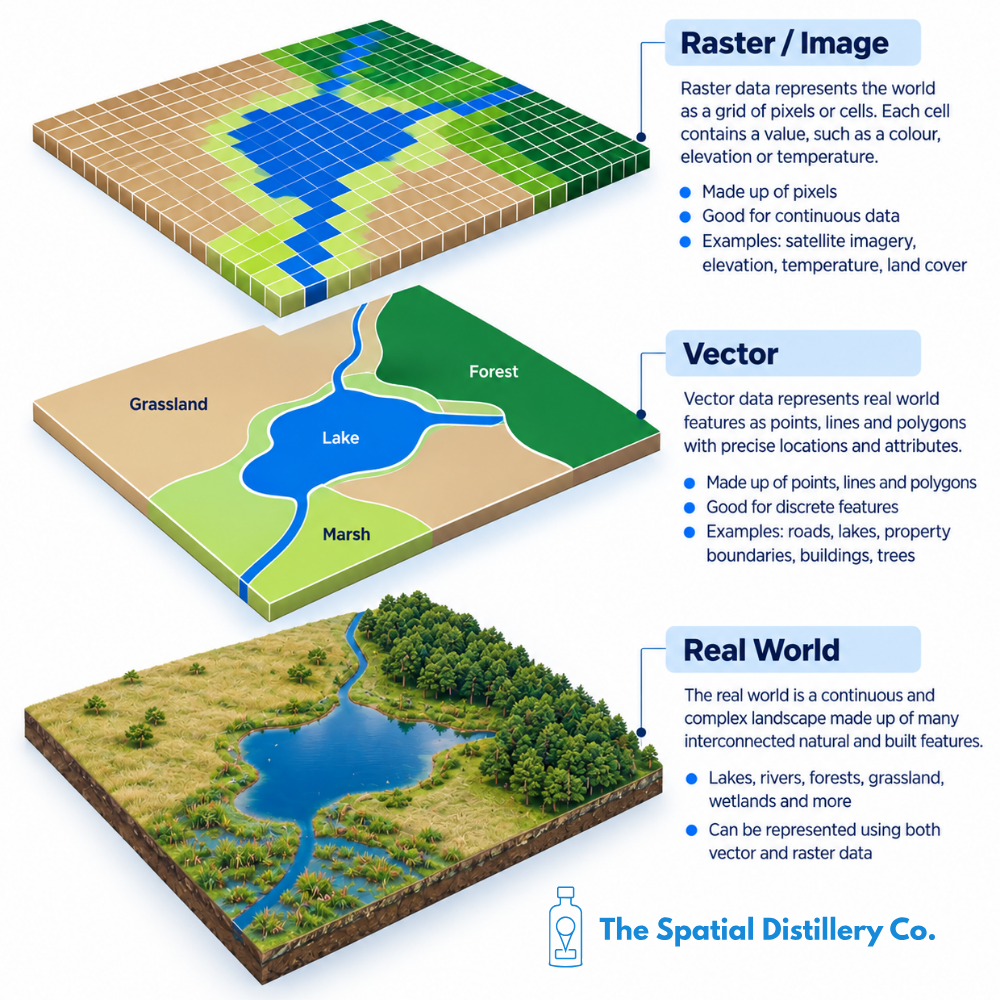
Vector data is generally used to represent individual, identifiable features such as roads, buildings, properties and trees.
Raster data represents information across an area using a grid of pixels or cells, making it particularly useful for imagery and continuous phenomena such as elevation, temperature and vegetation.
Both can be used together in the same GIS project.
What is Vector Data?
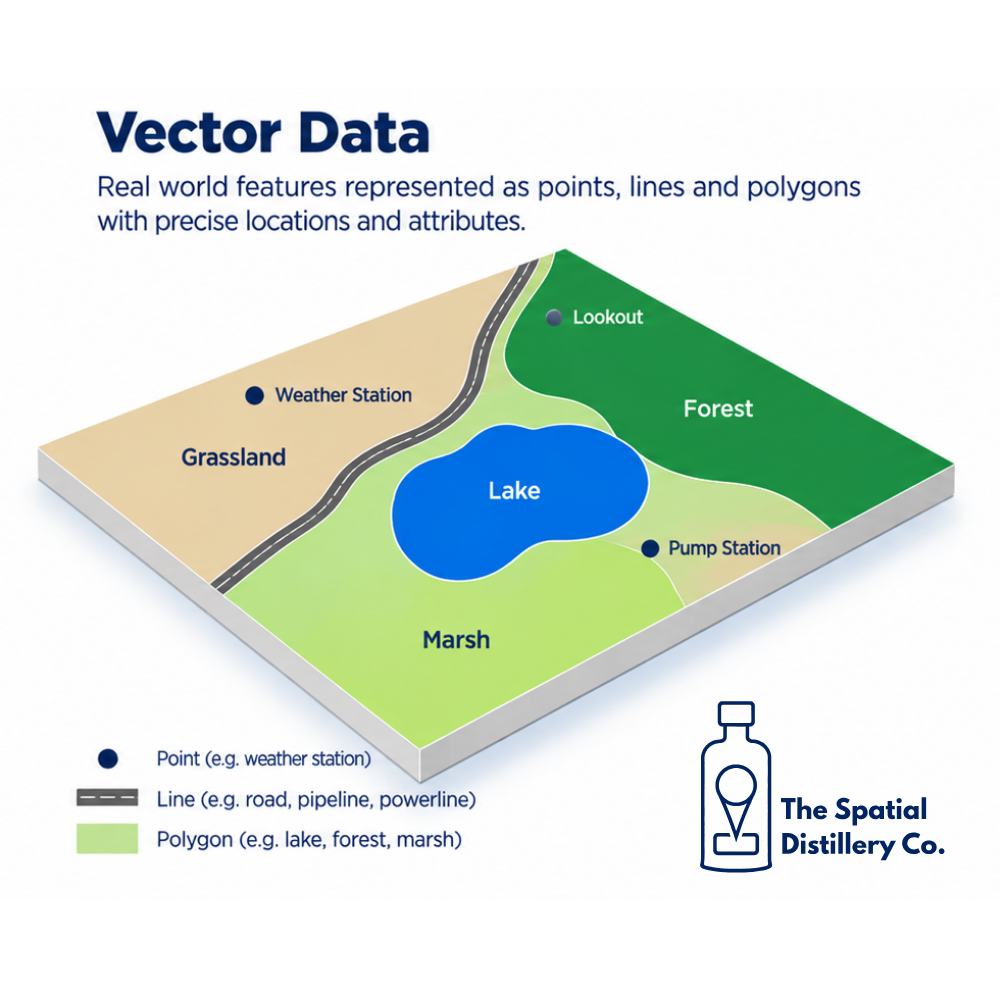
Vector data represents real-world features using points, lines and polygons. Think of vector data as drawing things on a map.
-
A point represents a specific location.
For example:
A house
A tree
A bus stop
A telecommunications tower
A retail store
A street address
A point normally has an X and Y coordinate that tells the GIS exactly where it is.
A point can also have additional information, known as attributes.
For example, a tree point could contain:
AttributeExampleSpeciesEucalyptusHeight12mConditionGoodPlanting year2018
The location tells you where the tree is. The attributes tell you what the tree is.
-
Lines are used to represent features that have length but not necessarily an area.
Examples include:
Roads
Railways
Rivers
Power lines
Telecommunications cables
Walking trails
Pipes
A road dataset might contain information such as road name, road type, speed limit and road classification alongside the line geometry.
-
Polygons represent areas with defined boundaries.
Examples include:
Property parcels
Local government areas
Suburbs
Parks
Buildings
Development sites
Catchments
Vegetation areas
A property parcel, for example, can be represented as a polygon showing its exact boundary. Attributes can then tell you the property's address, land use, area and other information.
Vector data in simple terms
Point = a location
Line = a path or connection
Polygon = an area
Together, these three geometry types can represent an enormous amount of the world around us.
What is Raster Data?
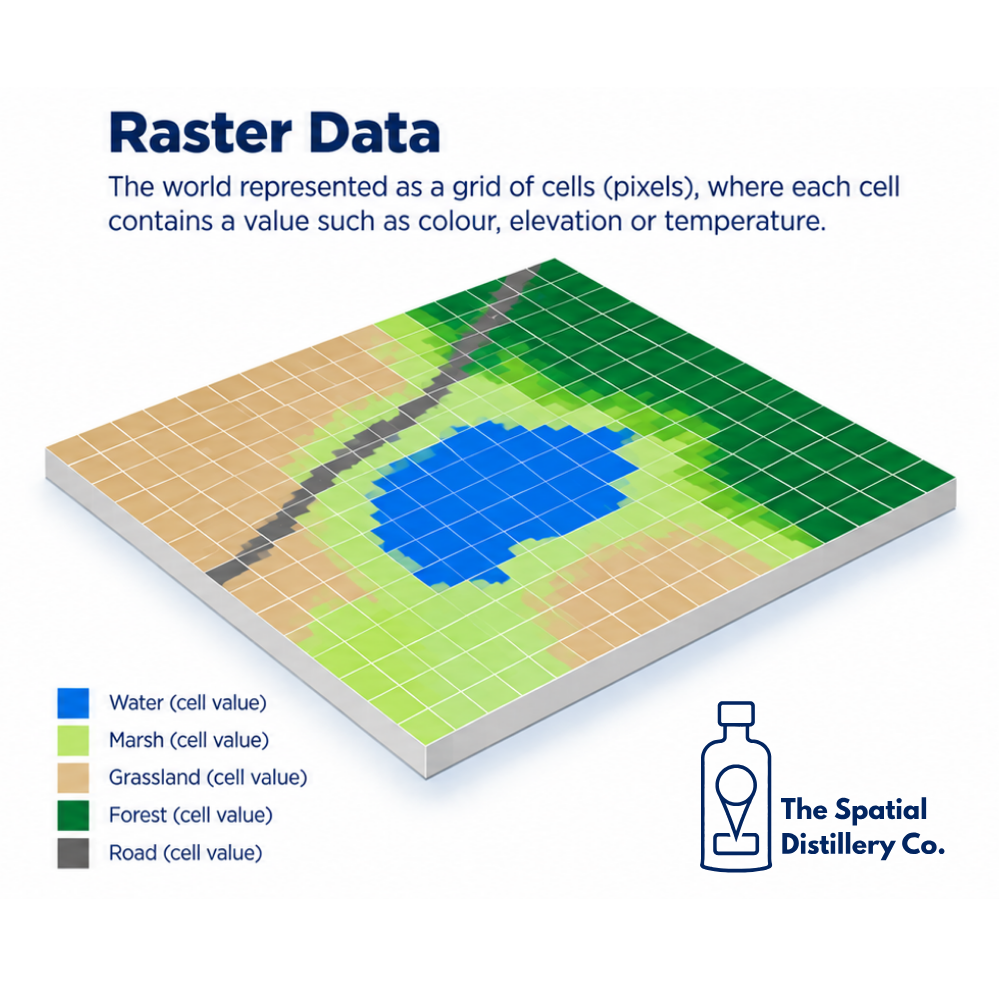
Raster data represents information as a grid of pixels or cells.
If you have ever zoomed into a digital photograph and seen individual pixels, you already understand the basic concept of raster data.
The difference is that a spatial raster is tied to a location on Earth.
Each pixel represents an area on the ground and contains a value.
That value might represent:
Colour in a satellite image
Elevation
Temperature
Rainfall
Vegetation
Land use
Soil characteristics
Population density
The size of the pixels is known as the resolution.
For example, a 10 metre raster has pixels representing approximately 10m × 10m areas on the ground.
Smaller pixels generally mean greater spatial detail, although higher resolution also usually means more data to store and process.
Common Types of Raster Data
Raster data can represent many different things :
-
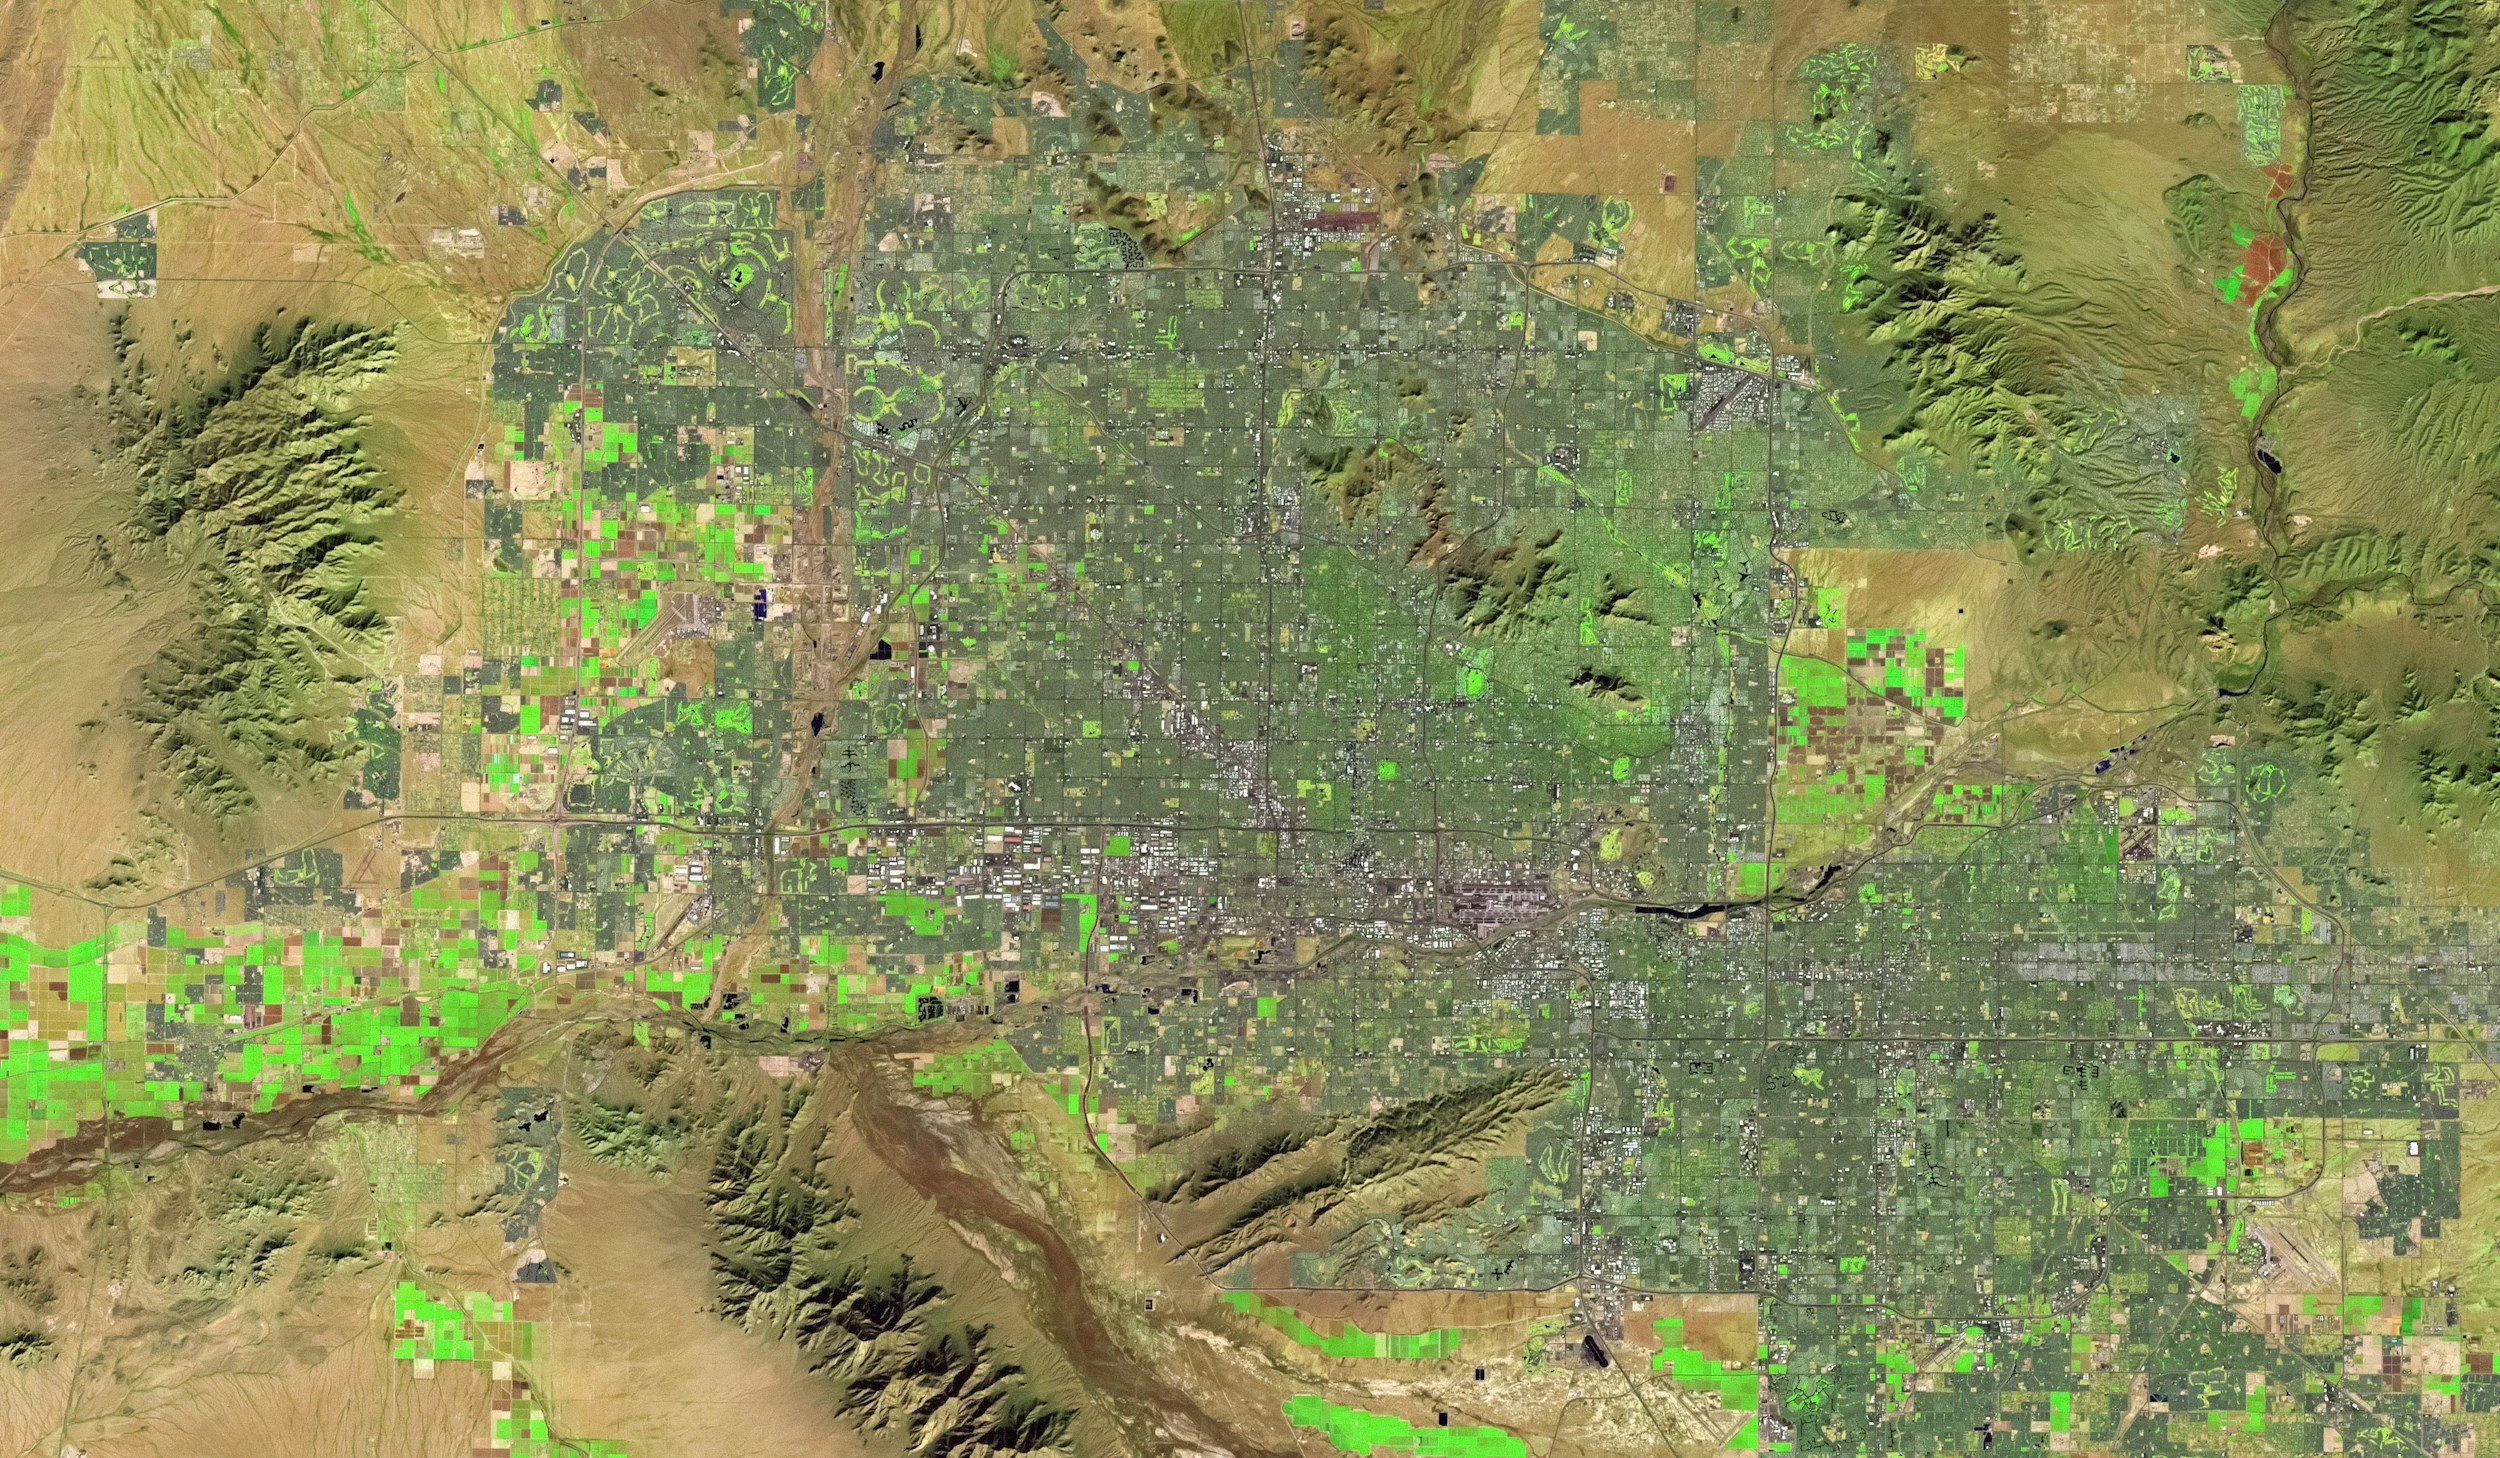
Satellite imagery is one of the most recognisable forms of spatial data.
Each pixel contains information captured by a satellite sensor.
Depending on the satellite and sensor, imagery can be used to identify and analyse:
Buildings
Roads
Vegetation
Water
Land cover
Agricultural activity
Environmental change
High-resolution satellite imagery can provide detailed views of individual buildings, properties and infrastructure, while lower-resolution imagery can be useful for analysing large areas.
-
Aerial imagery is similar to satellite imagery but is captured from aircraft.
It is commonly used for:
Property mapping
Urban planning
Infrastructure management
Environmental assessment
Tree canopy analysis
Development monitoring
Because aerial imagery can be captured at very high resolution, it is particularly useful when you need to see detail at the property or asset level.
-
A Digital Elevation Model (DEM) represents the height or elevation of the Earth's surface as a raster grid.
Each pixel contains an elevation value.
DEMs can be used to understand:
Terrain
Slopes
Drainage
Flood risk
Catchments
Visibility
Landscape characteristics
-
A Digital Surface Model (DSM) represents the elevation of the surface, including features such as buildings and vegetation.
This makes DSM data particularly useful when analysing the built and natural environment.
-
Raster data is particularly useful for information that changes gradually across a landscape.
Examples include:
Temperature
Elevation
Rainfall
Air quality
Soil moisture
Rather than having a single value for a particular object, the raster provides values across an entire area.
Other Types of Spatial Data
Vector and raster are the two fundamental spatial data models, but you will encounter many other types of geospatial data in real-world projects.
LiDAR
LiDAR stands for Light Detection and Ranging.
It uses pulses of laser light to measure distances and can produce extremely detailed information about the Earth's surface and objects above it.
LiDAR can be used to create:
Point clouds
Elevation models
Building heights
Tree heights
Terrain models
3D models
LiDAR is particularly powerful for understanding the three-dimensional structure of the environment.
Point Clouds
A point cloud is a collection of millions or even billions of individual points representing objects or surfaces in three-dimensional space.
Each point can contain information such as:
X coordinate
Y coordinate
Height
Intensity
Classification
Point clouds are commonly generated from LiDAR and are used in surveying, engineering, forestry, mining and 3D modelling.
3D Spatial Data
Spatial data isn't limited to two dimensions.
3D data can represent:
Buildings
Terrain
Underground infrastructure
Mines
Trees
Telecommunications infrastructure
Adding height or depth provides another dimension for analysing the real world.
Address Data
Addresses are also spatial data.
An address such as:
123 Smith Street, Sydney
can be converted into a geographic location using a process called geocoding.
Once an address has coordinates, it can be mapped, analysed and combined with other spatial datasets.
This is one reason high-quality address data is so important for location intelligence.
Network Data
Some spatial data represents connections and movement rather than simply locations.
Examples include:
Road networks
Rail networks
Telecommunications networks
Water networks
Electricity networks
Network data allows you to analyse things such as:
The fastest route
Service areas
Network connectivity
Infrastructure coverage
Customer proximity
Network capacity
Why Spatial Data Matters for AI
Spatial data is becoming increasingly important as organisations adopt AI.
AI can analyse enormous amounts of information, but the quality of its answers depends heavily on the quality of the data it is given.
Location provides an important context. For example, instead of asking:
"Which customers are valuable?" you might ask: "Which high-value customers are within 10 kilometres of our stores?"
Or: "Which properties are exposed to urban heat and have low tree canopy?" Or: "Where are the best locations for our next telecommunications sites?"
Spatial data gives AI the where it needs to answer these questions.
When authoritative spatial data is combined with AI, organisations can move from simply asking questions to making better location-based decisions.
Spatial Data Formats
You will encounter spatial data in many different file and database formats. Some of the most common include:
Vector formats
Shapefile
GeoPackage
GeoJSON
KML / KMZ
TAB
Geodatabase
PostGIS
Raster formats
GeoTIFF
JPEG / PNG with geographic information
Cloud Optimised GeoTIFF (COG)
IMG
ECW
The format is essentially the container used to store and exchange the spatial data.
The important thing is understanding what the data represents, how accurate it is, where it came from and how it can be used.
Spatial Data Needs a Coordinate System
There is one more important concept to understand.
Spatial data needs to know where it is on Earth.
This is achieved using a Coordinate Reference System (CRS).
A CRS defines how locations on the curved surface of the Earth are represented using coordinates on a map or computer.
You may encounter terms such as:
Latitude and longitude
GDA2020
MGA2020
WGS84
EPSG codes
If two datasets use different coordinate systems, GIS software can usually transform them so they line up correctly.
Getting the coordinate system right is fundamental to accurate spatial analysis.
Spatial Data FAQs
-
Spatial data is information that has a location associated with it. It tells you where something is as well as information about what it is.
-
The two main types are vector data and raster data. Vector data represents features using points, lines and polygons, while raster data represents information as a grid of pixels or cells.
-
Yes. Google Maps is a good example of a system that uses many types of spatial data, including roads, places, boundaries, imagery and geographic coordinates.
-
An address becomes spatial data when it is associated with a geographic location, such as latitude and longitude. This process is known as geocoding.
-
Spatial data is the information about places and locations. GIS is the technology and tools used to store, manage, map, analyse and share that information.
-
Vector data is generally used to represent discrete features with defined locations or boundaries, such as roads, properties, buildings, trees and administrative boundaries.
-
Raster data is particularly useful for imagery and information that varies across an area, such as satellite imagery, elevation, temperature, rainfall and vegetation.
-
Absolutely. Most GIS projects use a combination of vector and raster data. For example, property boundaries can be displayed over aerial imagery and analysed alongside elevation or temperature data.
Need Spatial Data?
The Spatial Distillery helps organisations find, manage, analyse and use spatial data to solve real-world business problems.
From authoritative address and property data to satellite imagery, environmental data and location intelligence, we can help you find the right data for your project.
Talk to our spatial data experts and discover what is possible with location.